Quick note on technical analysis from a $GOED bag-holder
What do the technical analysis textbooks tell us about where the price might end up in the short-term?

While I’ve been patiently HODL-ing my $GOED position1, I’ve spent some time studying its chart as a way to build out my technical analysis (TA) toolkit. What follows is a layman’s thoughts about the subject of TA and my attempt at using TA to predict the price action of $GOED in the coming weeks.
TA gets a bad rap. For a while I fell into the group that thought that any form of looking at price action, volume, moving averages, indicators, etc. was the equivalent of financial astrology. I thought that chart-voodoo was certainly not a way to forecast future price trends, and that my time would be far better spent pursuing nearly any other topic in the world of investing.
I suspect that this hubris; much like a teenager who rebels against their parents advice because they think they know everything, only to later realize in their later years that Mom and Dad actually might have known a thing or two, was due to my lack of understanding and perspective on the subject. Hell, if algorithmic trading and many investment managers are so heavily reliant on TA, there must be something to it. Even the Roaring Kitty of GameStop fame used TA in his process.
Perhaps the disdain for TA comes partly from the value-investing premise that in the short term, the financial markets do not expressly care about the specific value of a particular company; but instead are focused disproportionately on the current sentiment surrounding an investment. A value investor makes their bread by finding an undervalued stock based on an analysis of the financial statements of a company, buying it, and then waiting for the price of the stock to reflect the underlying intrinsic value of the company.
As the legendary Seth Klarman pointed out in his preface he wrote for the 6th edition of Security Analysis (the de facto Bible for value investors):
…those who view the market as a weighing machine - a precise and efficient assessor of value — are part of the emotionally driven herd. Those who regard the market as a voting machine — a sentiment-driven popularity contest — will be well positioned to take proper advantage of the extremes of market sentiment.
So how does this relate to looking at charts again?
Where does value investing, often characterized by analysts who spend hours poring over financial statements and building discounted cash flow models to ascertain if the intrinsic value is greater than the current share price of the security plus a little extra margin of safety, crossover with the technical analysts, who may only care about what the chart looks like as a precursor to going long or short?
The two branches are often presented as being diametrically oppositional styles of investing. One branch, the value investors, think that the market is extremely inefficient, and that the price action will come to eventually meet the underlying fundamentals of a company. The other branch, the technical analysts, believe that the market is perfectly efficient and that anything that can affect the price from fundamentals to psychology, is already reflected in the market as the current price of the security.
John Murphy, the author of Technical Analysis of the Financial Markets (regarded as writing another investing Bible, this time for technical analysis), helps to reconcile the two seemingly irreconcilable ideas2:
…Both of these approaches (fundamental and technical) to market forecasting attempt to solve the same problem, that is, to determine the direction prices are likely to move. They just approach the problem from different directions. The fundamentalist studies the cause of market movement, while the technician studies the effect.
The technician, of course, believes that the effect is all that he or she wants or needs to know and that the reasons, or the causes, are unnecessary. The fundamentalist always has to know why.
…One explanation for these seeming discrepancies is that market price tends to lead the known fundamentals… while the known fundamentals have already been discounted and are already “in the market”, prices are now reacting to the unknown fundamentals…
… (Technical analysts) knows that eventually the reasons for market action will become public knowledge
You can see this principle in action by looking at the recent charts of tech stocks. Even the stalwart companies in this sector: those with strong balance sheets, excellent unit economics, an impregnable moat, demonstrably consistent and high growth rates, and throwing off record amounts of free cash flow (see: Alphabet $GOOG & Apple $AAPL) were still brutalized by the recent market sell-off, recently shedding nearly as much of a percentage of their market cap as they had lost at the outset of the COVID-19 pandemic.
Such “stalwart” stocks are selling off arguably not because the fundamentals of the business have deteriorated from before (in some cases they may have improved significantly), but because of the change sentiment surrounding other stocks in this sector, as reflected in the price-action of the securities.
Fundamentally, many think that the stalwart stocks still appear to be sound investments, but the price-action reveals a disconnect between what the “sophisticated” investor thinks a stock is/will be worth3, and what the market thinks a stock is worth.
For a fundamentals focused market participant like myself who is looking to gain an edge, I have to believe in the premise that the gap between the price of a security and the intrinsic value of a security will become closer over time.
Thus, there appears to be an opportunity to use TA to take advantage of a short term mispricing - for being either on the bull-side, or the bear-side; in essence working to get to the same answer as the purely fundamental investor, but from studying the chart instead of the financial statements to predict where the price will go next to find an edge.
Enough theory. Now I’ll try my best to put TA into practice, using $GOED as my target.
Please refer to my disclaimer and please do not interpret any of the following as an investment recommendation or as financial advice. I urge you to do your own due diligence and take all predictions or forecasts with a big grain of salt. For example; the latest bear market has been predicted hundreds of times over the last ten years.
To set the stage, I believe this company is significantly undervalued and an attractive investment, particularly at the current valuation4. Sometimes that’s referred to as the “Steak”. Let’s assume the meat (fundamentals) of the investment appears sound. Now let’s look at the “Sizzle” - or the recent and upcoming catalysts:
Recent catalysts (that may or may not have been already priced in):
5/16 - Q1 2022 Earnings - $GOED posted earnings yesterday, marginally beating revenue predictions and beating expected EPS by ~50%. They reiterated their guidance on top-line growth percentage of high teens to low 20’s with roughly flat gross and EBITDA margins5.
5/11 - $GOED releases announcement on securing a $140M credit agreement with Bank of America
The upcoming catalysts that I’ve identified or that appear likely to manifest in the short-term:
$GOED will rebrand their business with a new name, logo, and brand ethos - combining the legacy Goedeker business with Appliances Connection
End of blackout period on 5/18 - will allow for:
The implementation of $25M approved share buyback first authorized in 12/21/2021
Potential insider purchases of securities by new executive team hired in the last six months
Potential announcements on new B2B offerings and partnerships currently in the works with Zillow’s home center and the Property Brothers6
Various marginal items such as: updated information from integrated financials appearing in scanners, increased media coverage, analyst upgrades, improvements in macro environment, new 13F filings, etc.
The idea is that these catalysts may work synergistically to fuel price moves, and price moves may happen as demand increases in anticipation of such catalysts.
State of the Technicals:
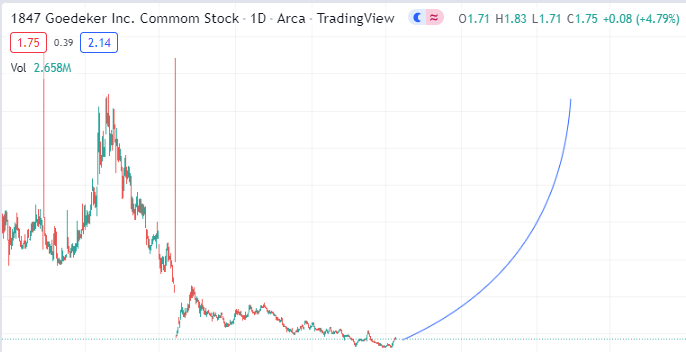
Thesis: I think we are due to complete a reversal in the trend from bearish to bullish.
Note that of the following; I would classify some of this as marginal analysis; and use it all together it in conjunction with a review of the fundamentals, story of the business, overall macro environment, trends, tailwinds, etc. I am not treating just one of these technical indicators by itself as gospel, but as a whole am trying to get a feel for the imbalances in the forces of supply and demand.
*I do feel like TA may be more applicable to this ticker than others because I have a suspicion that a lot of the price-action is algorithmic*.
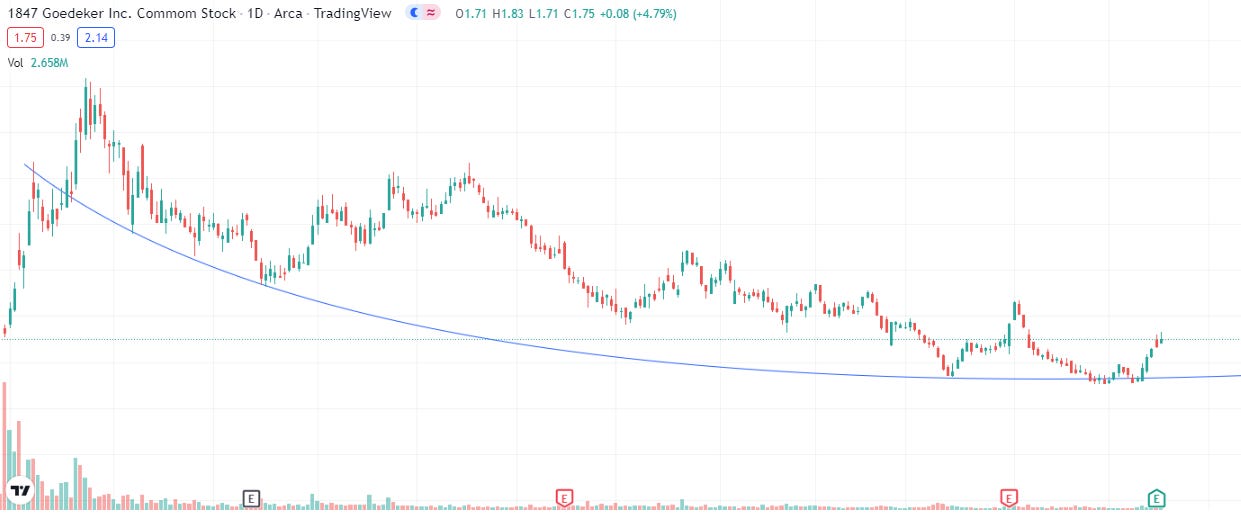
1. Chart appears to be flattening out - using ~ $1.3/share as long-term resistance which has been tested three times since mid-March:
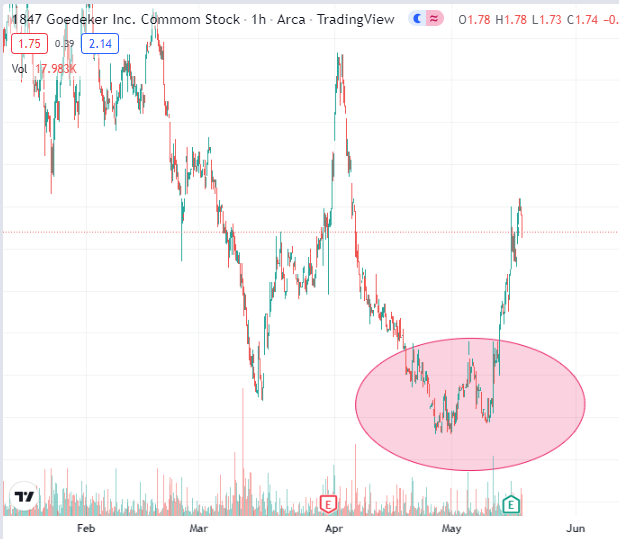
2. Double bottom prior to earnings run-up:
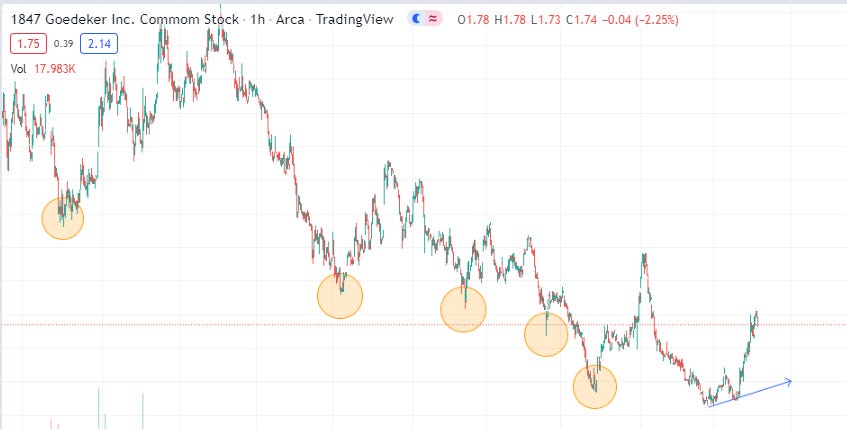
3. First higher-low since listing:
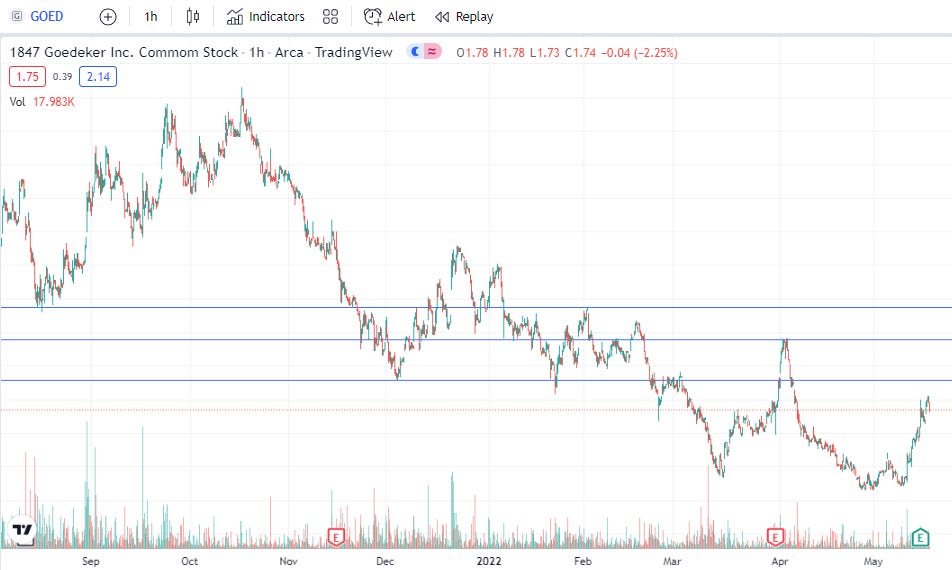
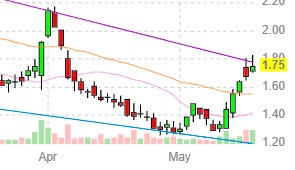
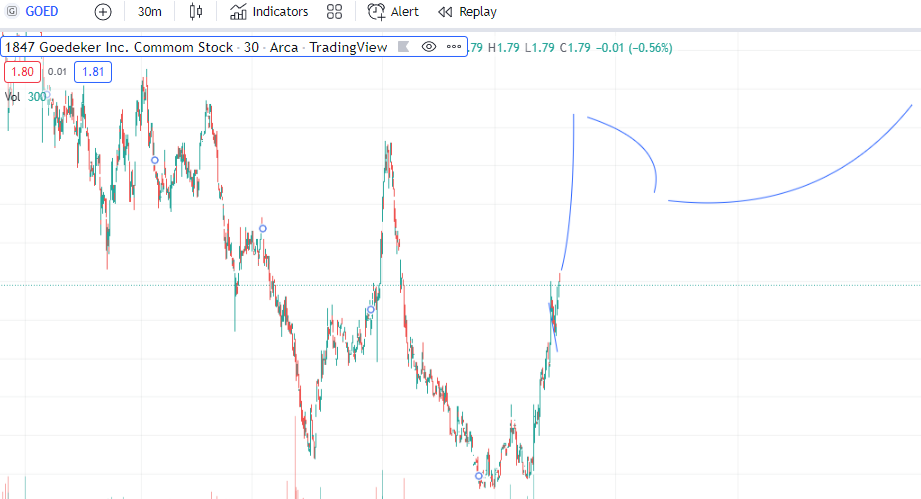
4. Approaching long-term areas of support and resistance (blue lines), if flipped from resistance to support on the strength of earnings & upcoming catalysts, would help solidify the reversal in trend and reduce the likelihood that this is a false breakout:
5. Tweezer bottom at all-time low (reached during peak fear in the market in the last three weeks):
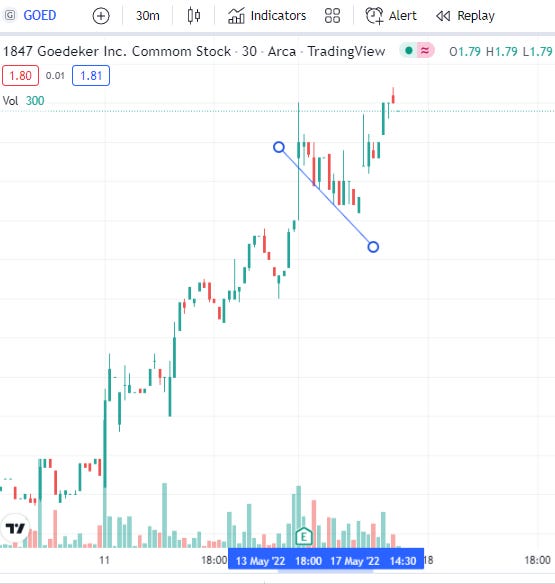
6. We are in the middle of a Bull flag formed at latest earnings (which bounced off of an area of previous congestion on the chart ~$1.6):
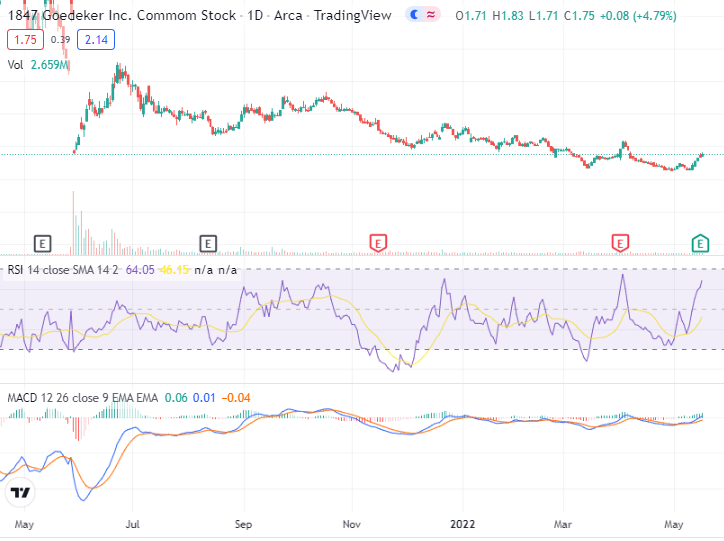
7. Momentum Indicators: On the daily, RSI flipping from oversold to overbought; looking for it to stay in the overbought range. MACD flipping from red to green. 20-day moving average is starting to head towards the 50-day moving average for a potential bullish cross-over (second snip)
Other miscellaneous items and marginal analysis:
Anecdotally, I feel like the stock has shown relative strength in the market compared to the sell-offs suffered in other sectors other than energy these last few weeks.
Gap to fill back to previous high of $16 prior to acquisition by Appliances Connection:
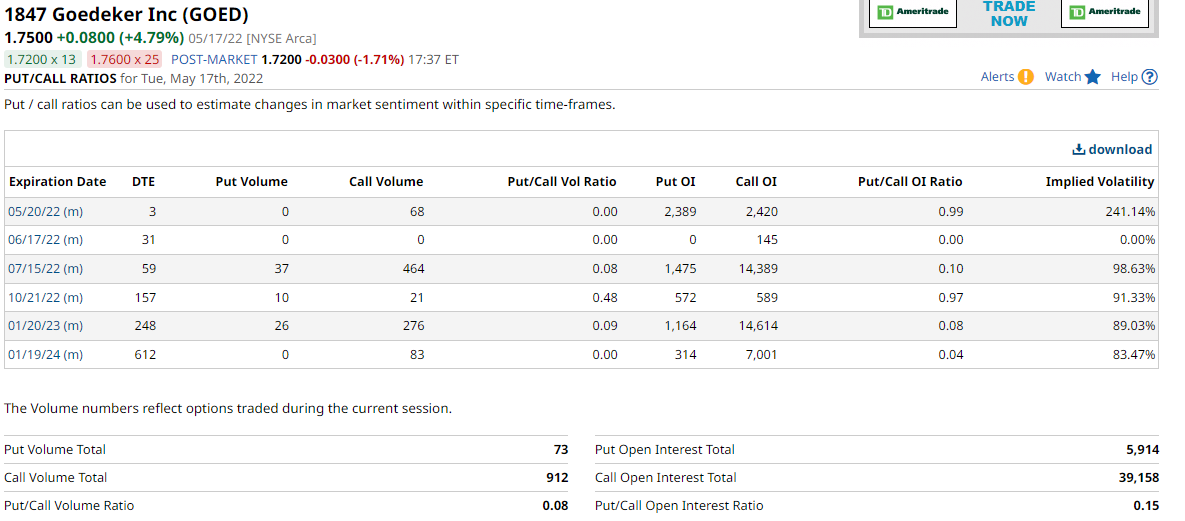
PCROI: Doesn’t appear to be that many options expiring this Friday, and the PCROI is ~1; inferring that bulls/bears sentiment is roughly matched. Looking out in the future; there is a massive skew towards calls which I think may cause some volatility as we get closer to those option expiration dates in July 2022 and January 2023:
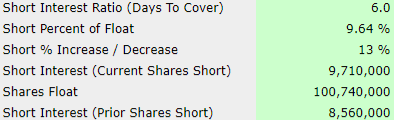
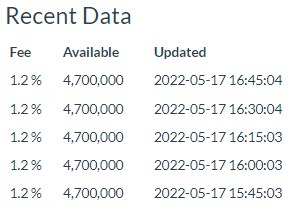
Short Squeeze Likelihood: Low. It doesn’t appear like a significant percentage of the float is sold short. Additionally, the short fee is not very painful, only 1.2% right now.
WhaleWisdom: More funds have filed 13F’s, working to effectively reduce the float that can be actively traded and help to bring more eyeballs to the ticker for those who track 13F activity.
It also demonstrates that these funds may share my long-thesis, which is comforting, because they operate with far more information and precision than I will ever have as a retail investor.
Notable buys in May per 13Fs: Jane Street (+1.5M shares), Morgan Dempsey Capital Management (+3.6M shares), Renaissance Technologies (+1.0M shares), Brightlight Capital Management LP (+1.5M shares), various other funds with purchases of <1 million shares.
Notable sells in May per 13Fs: Sabby Management, LLC (short-selling fund) (-0.3M shares), Timelo Investment Management (-1.4M shares), various other funds with sales of <1 million shares.
My Prediction7:
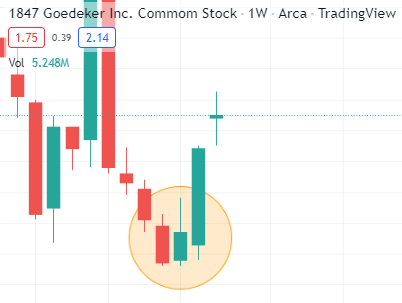
Bull flag completes, price moves to ~$2.25 and encounters resistance, then sells off (partly profit-taking from short term traders who are up significantly if they purchased close to the lows and partly due to the warrant strike price of $2.25).
Looking for ~$2 to hold as support on the pull-back and consolidate there until stock buybacks, insider buys, and rebrand fuel the next move up. Maybe something like the blue lines I’ve drawn in below:
Welp, there’s my prediction. The stock could go up from here, and maybe it going up has something to do with the TA and those catalysts I outlined. Or, it could go up for a million reasons other than what I speculated. And of course, as has been evident in the market so far in 2022, it can certainly go down.
The only thing I know for sure is that the chart will continue to go to the right.
Let me know where you think it will end up! Thanks for reading!
Thanks for reading Round the World Investing! Subscribe for free to receive new posts and support my work.
A position I became interested in both due to its chart and based on its fundamental metrics (relative cheapness to peers, industry tailwinds, favorable valuation, etc.). I took a more fundamental than technical approach to this one.
Technical Analysis of the Financial Markets by John J Murphy, p. 5, 6
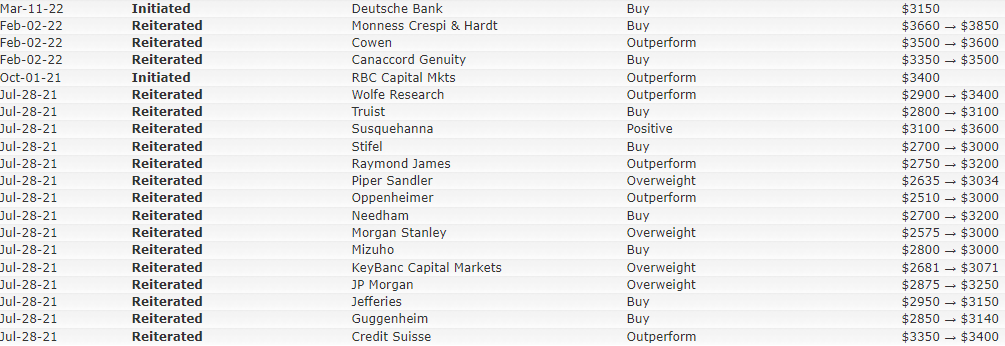
$GOOG Analyst Targets per Finviz:
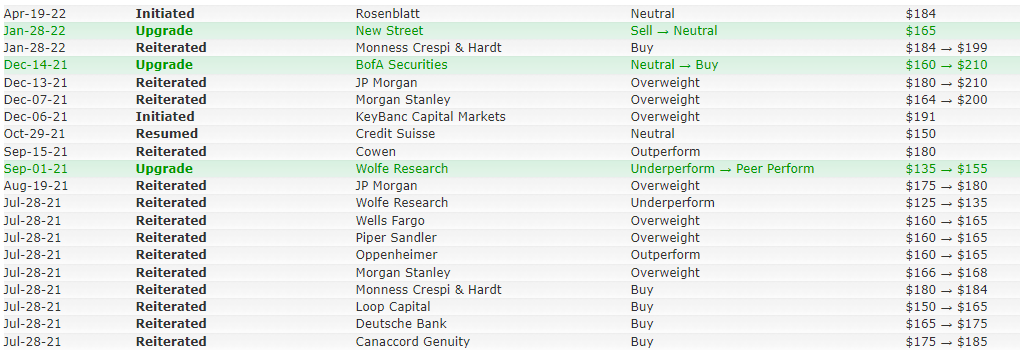
$AAPL Analyst Targets per Finviz:
There’s a lot to say here. There are many great analyses, podcasts and due diligences on this ticker online, all written by people much more experienced than me, which I suggest you check out with a google search!
I have yet to find an iron-clad bear case - if you have one; please send it my way!
Given macro headwinds such as inflation, housing trends, interest rates, etc.; in my opinion it is incredible that they are able to affirm their guidance in this environment, and demonstrates the discipline and growth focus of management. They are filling a historically low percentage of orders and still out-performing.
Again, see disclaimer.
We need a close above 2.25 for the first price target to be technically met. Currently price extensions over 2.25, are 2.48, 2.75, 2.98, 3.62. I would guess EOY price should average 3.50, unless a new fundamental catalyst comes into play.